
One issue in Cathodic Protection (CP) Management is to handle large amount of data. Some specialised programs are available in the market with premium price.
We are not discussing those data package, which are normally having lots of redundant functions. In CP daily management, one typical task is to visualise and comparing the data logging data from different test posts recorded in the same time. people will normally use spreadsheet such as MS EXCEL to plot the data. However, MS do have the limitation of 32,000 data point for each dataset, which is often not sufficient in CP data logging.
Veusz is a GUI scientific plotting and graphing package, which Veusz is Free Software and is licenced under the GPL.It handles 1 D data very well, typically with slightly different timestamps. There is no limit on the number of data points for each dataset, which is very convenient to process the data logging document.
You may zoom-in the particular section of the interest easily, which is handy to observe and compare the particularly waveform during the interruption for multiple test posts.
One restriction was the imported data format could be restrictive, typically for Date/Time, i.e. has to be ISO formate YYYY-MM-DDTHH:MM:SS.000. Otherwise, Veusz will import it as TEXT rather DATE.
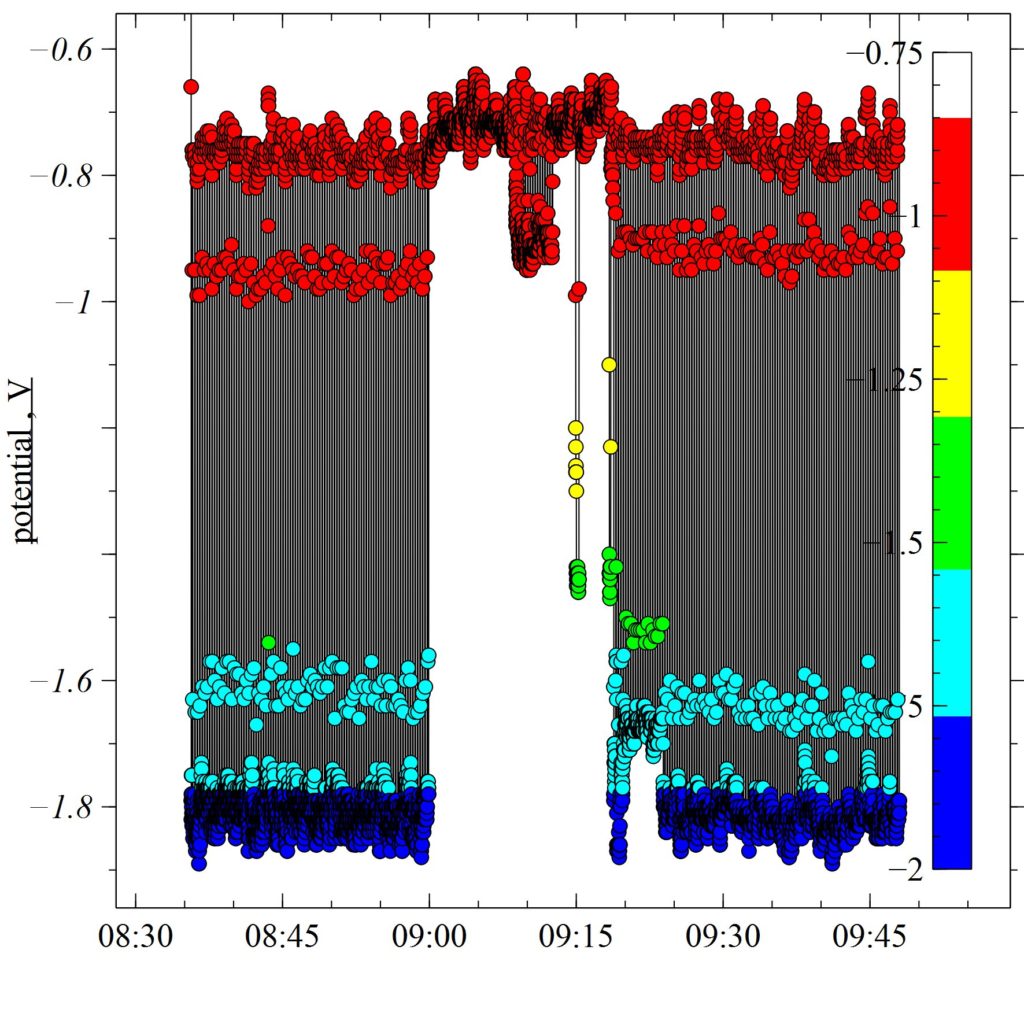
Data Logging: Full time scale
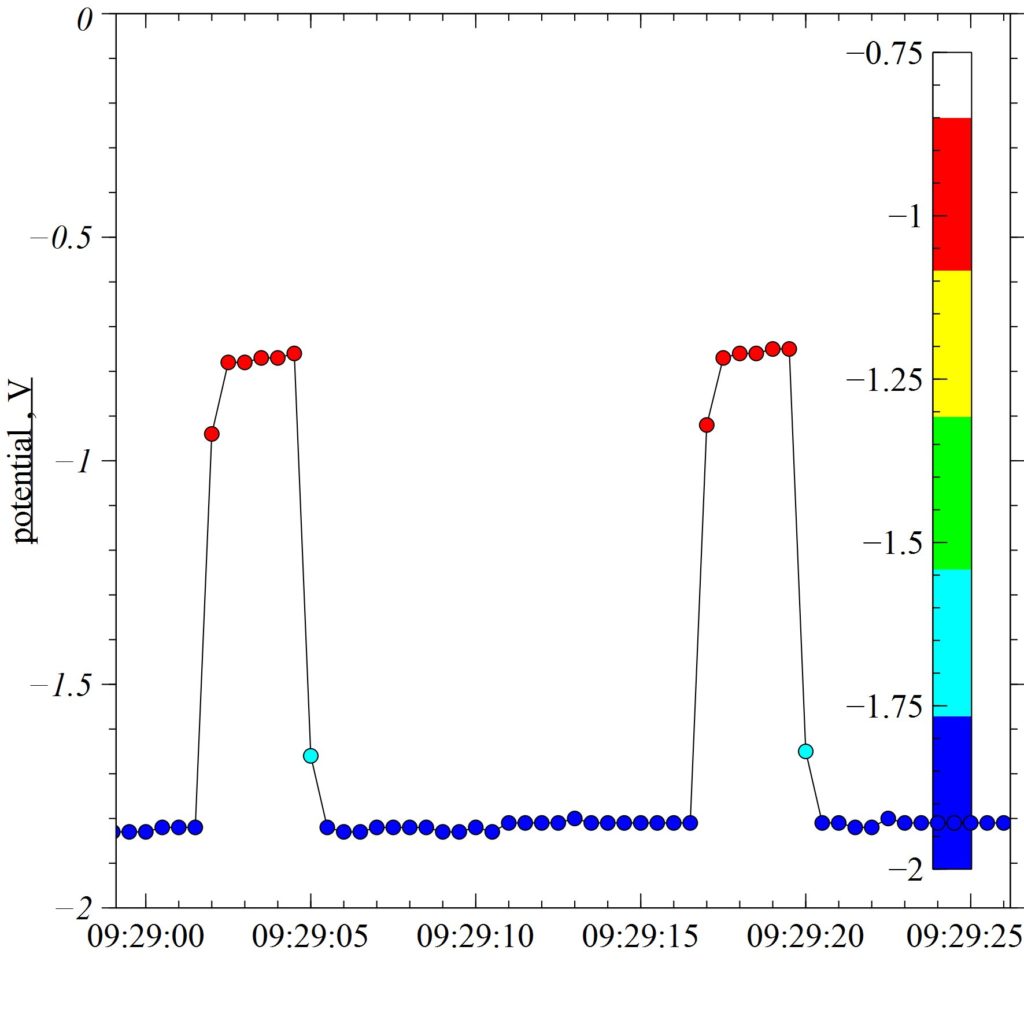
Single interruption waveform
Related Posts
 Electrical Short Pipeline Potential Measurement and its Implication in Pipeline CP Management Practice
- Corrosion of Embedded Ferrous Metals in Woods
- Corrosion Failure Investigation-Case Study
- Adenosine Testing and its Interpretation in Oil and Gas Field Microbial Status
- Cathodic Protection Numeric Method Summary Report
- Cathodic Protection Numeric Simulation